> ## Documentation Index
> Fetch the complete documentation index at: https://docs.a7manager.se/llms.txt
> Use this file to discover all available pages before exploring further.
# Strategic KPI
> Quarter-over-quarter reliability, compliance and defect-rate metrics.
Fleet-level reliability over time. This page covers **completed quarters only** — the current
partial quarter is excluded — with each figure shown against the same quarter one and three
years earlier.
***
## Tabs
| Tab | Covers |
| ----------------------------------- | ----------------------------------------------------------------------- |
| **Vehicle Reliability** *(default)* | MDBF, failures per million km, mean time to repair |
| **Component Reliability** | Dismount counts and mean kilometres to dismount |
| **Product-Group Defect Rate** | Defect rate per million km, broken down by product group |
| **Compliance & FU/AU** | Maintenance compliance, planned versus unplanned, overdue at period end |
| **Repeat Defects** | Share of defects that recurred on the same vehicle and area |
***
### Vehicle Reliability
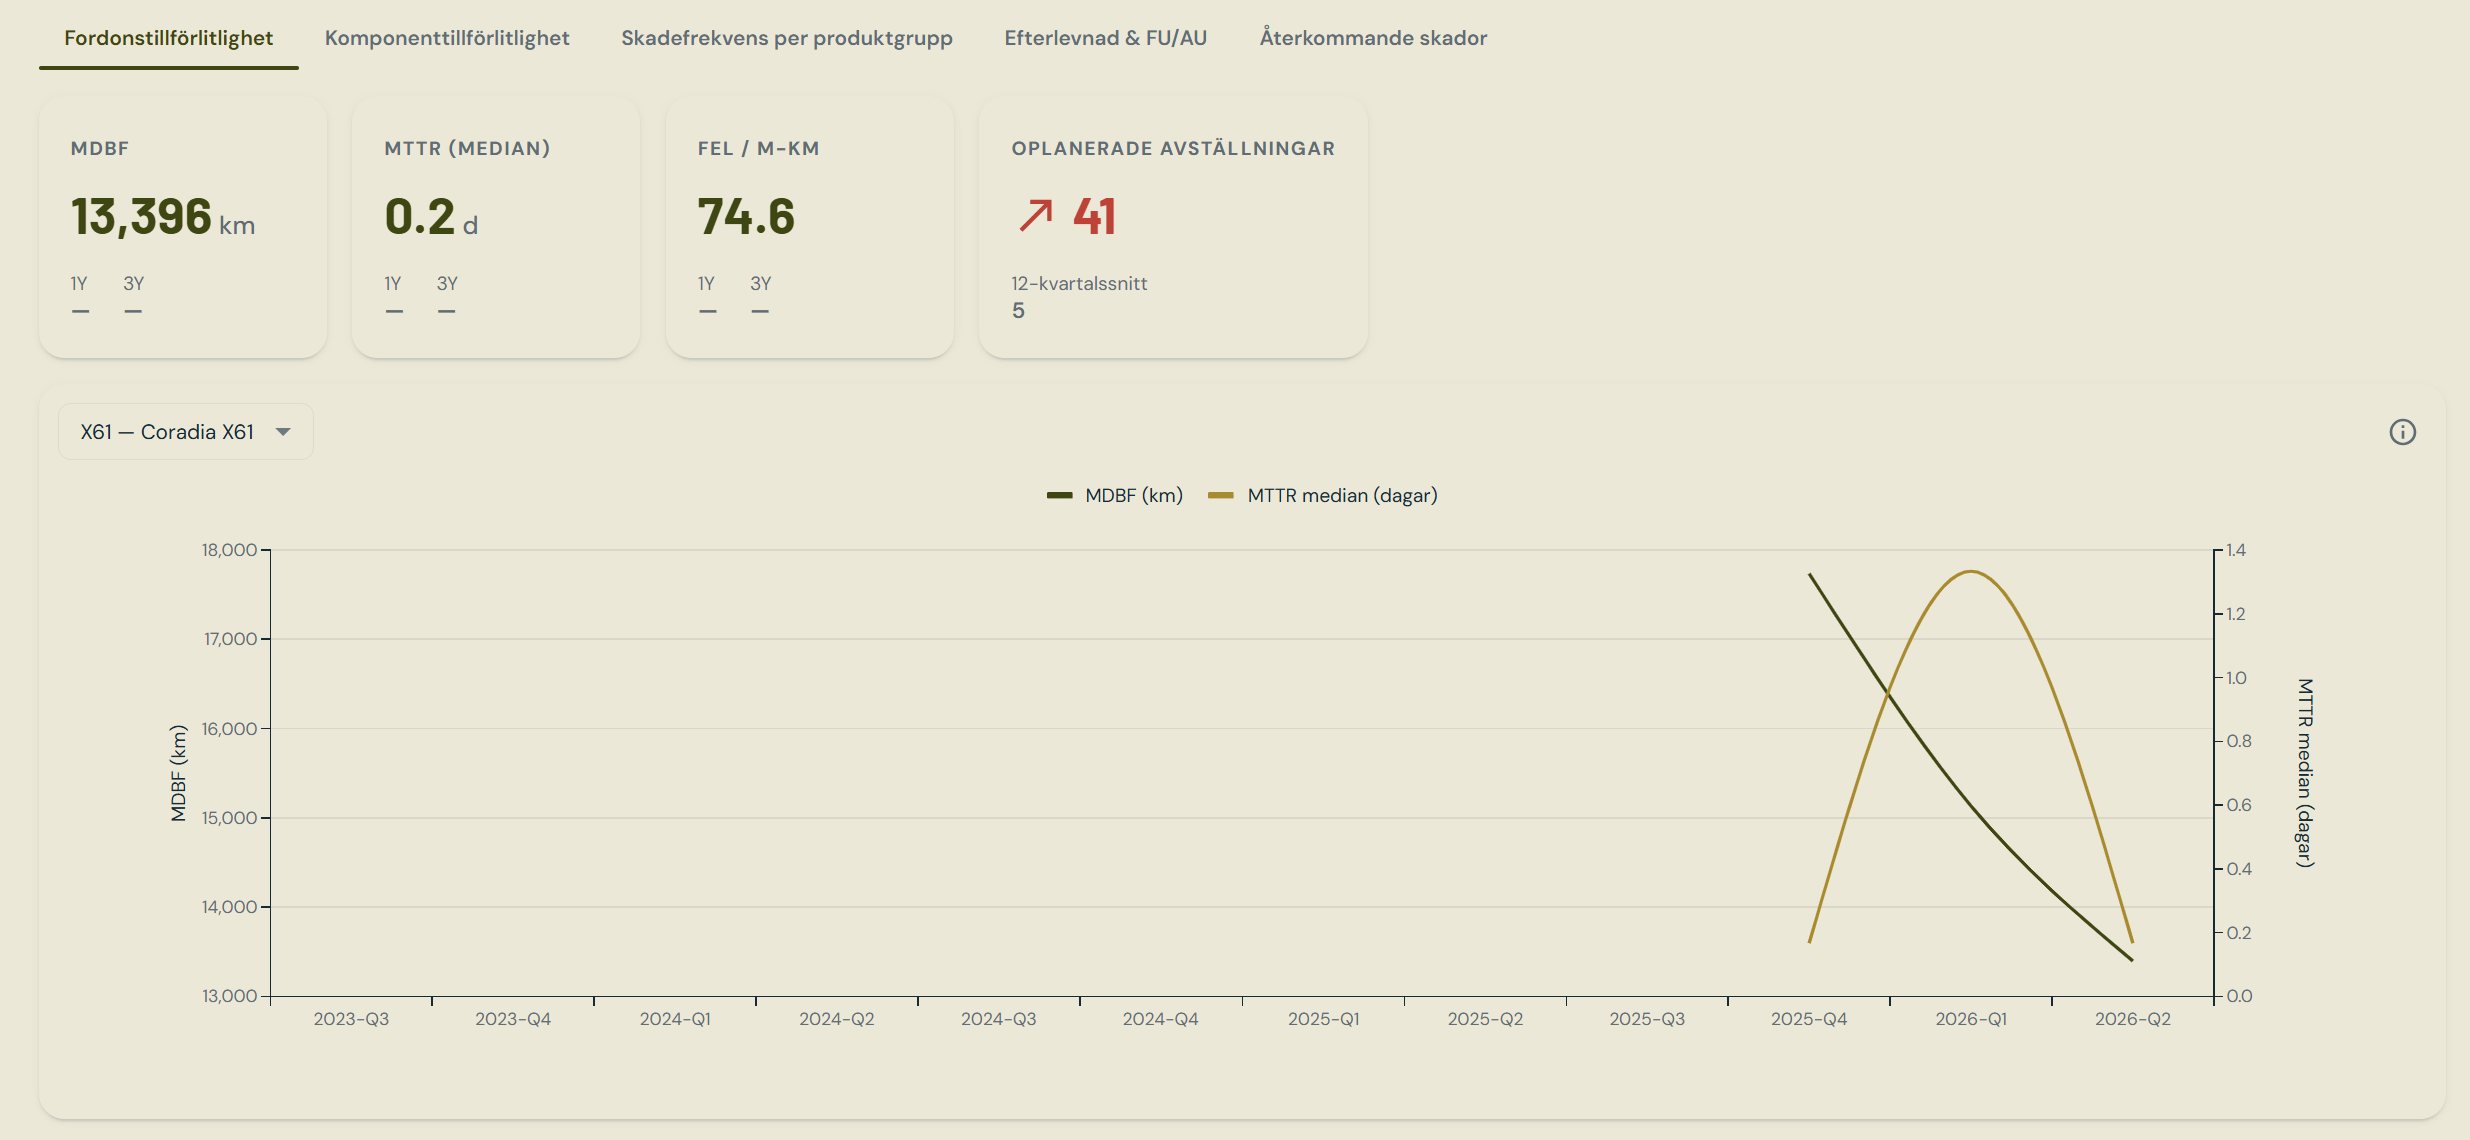 Scoped to one vehicle type.
| Metric | Definition |
| --------------------------- | ------------------------------------------------------------------------------------------------------------------------------------------------- |
| **MDBF** | Fleet kilometres ÷ unplanned-repair events. A mean *distance* between failures, not a time |
| **Failures per million km** | Unplanned-repair events ÷ fleet km × 1 000 000 |
| **MTTR** | Median days from out-of-service to back-in-service, over unplanned repairs **closed** in the quarter. The mean is available as a secondary figure |
Fleet kilometres are the sum across the type's vehicles of the distance covered between the
quarter's start and end readings.
***
### Component Reliability
Scoped to one vehicle type.
| Metric | Definition |
| --------------------------- | ------------------------------------------------------------------------------------------------------------------------------------------------- |
| **MDBF** | Fleet kilometres ÷ unplanned-repair events. A mean *distance* between failures, not a time |
| **Failures per million km** | Unplanned-repair events ÷ fleet km × 1 000 000 |
| **MTTR** | Median days from out-of-service to back-in-service, over unplanned repairs **closed** in the quarter. The mean is available as a secondary figure |
Fleet kilometres are the sum across the type's vehicles of the distance covered between the
quarter's start and end readings.
***
### Component Reliability
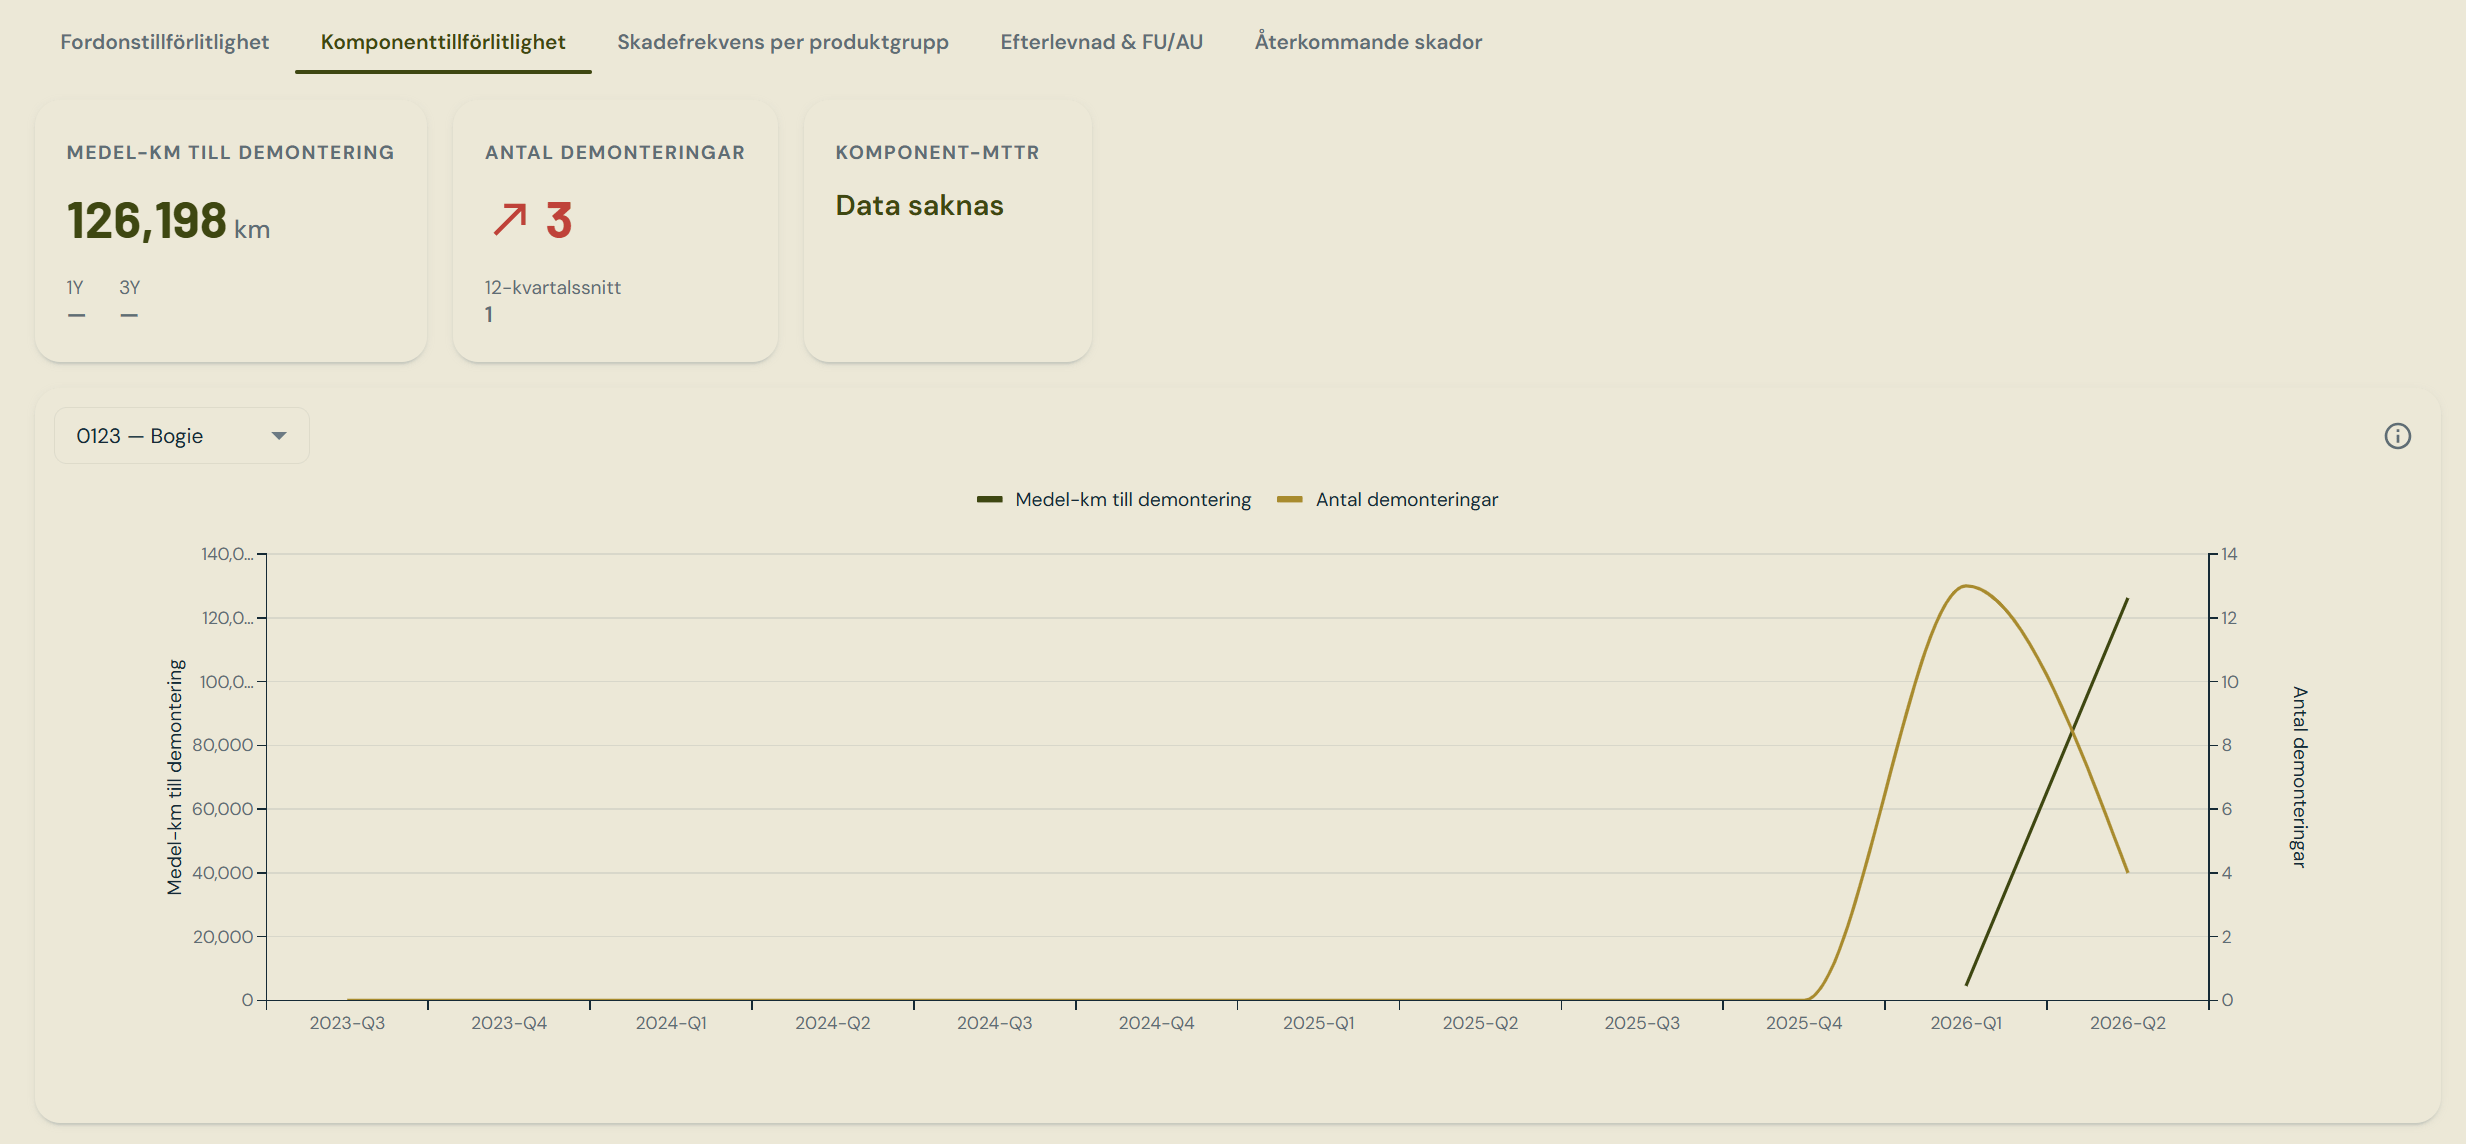 Scoped to one component type. Reports the number of dismounts in the quarter and the **mean
kilometres from mount to dismount**.
Component MTTR is **not available at the moment** — implementation will calculate based on component repair cycle module.
***
### Product-Group Defect Rate
Scoped to one component type. Reports the number of dismounts in the quarter and the **mean
kilometres from mount to dismount**.
Component MTTR is **not available at the moment** — implementation will calculate based on component repair cycle module.
***
### Product-Group Defect Rate
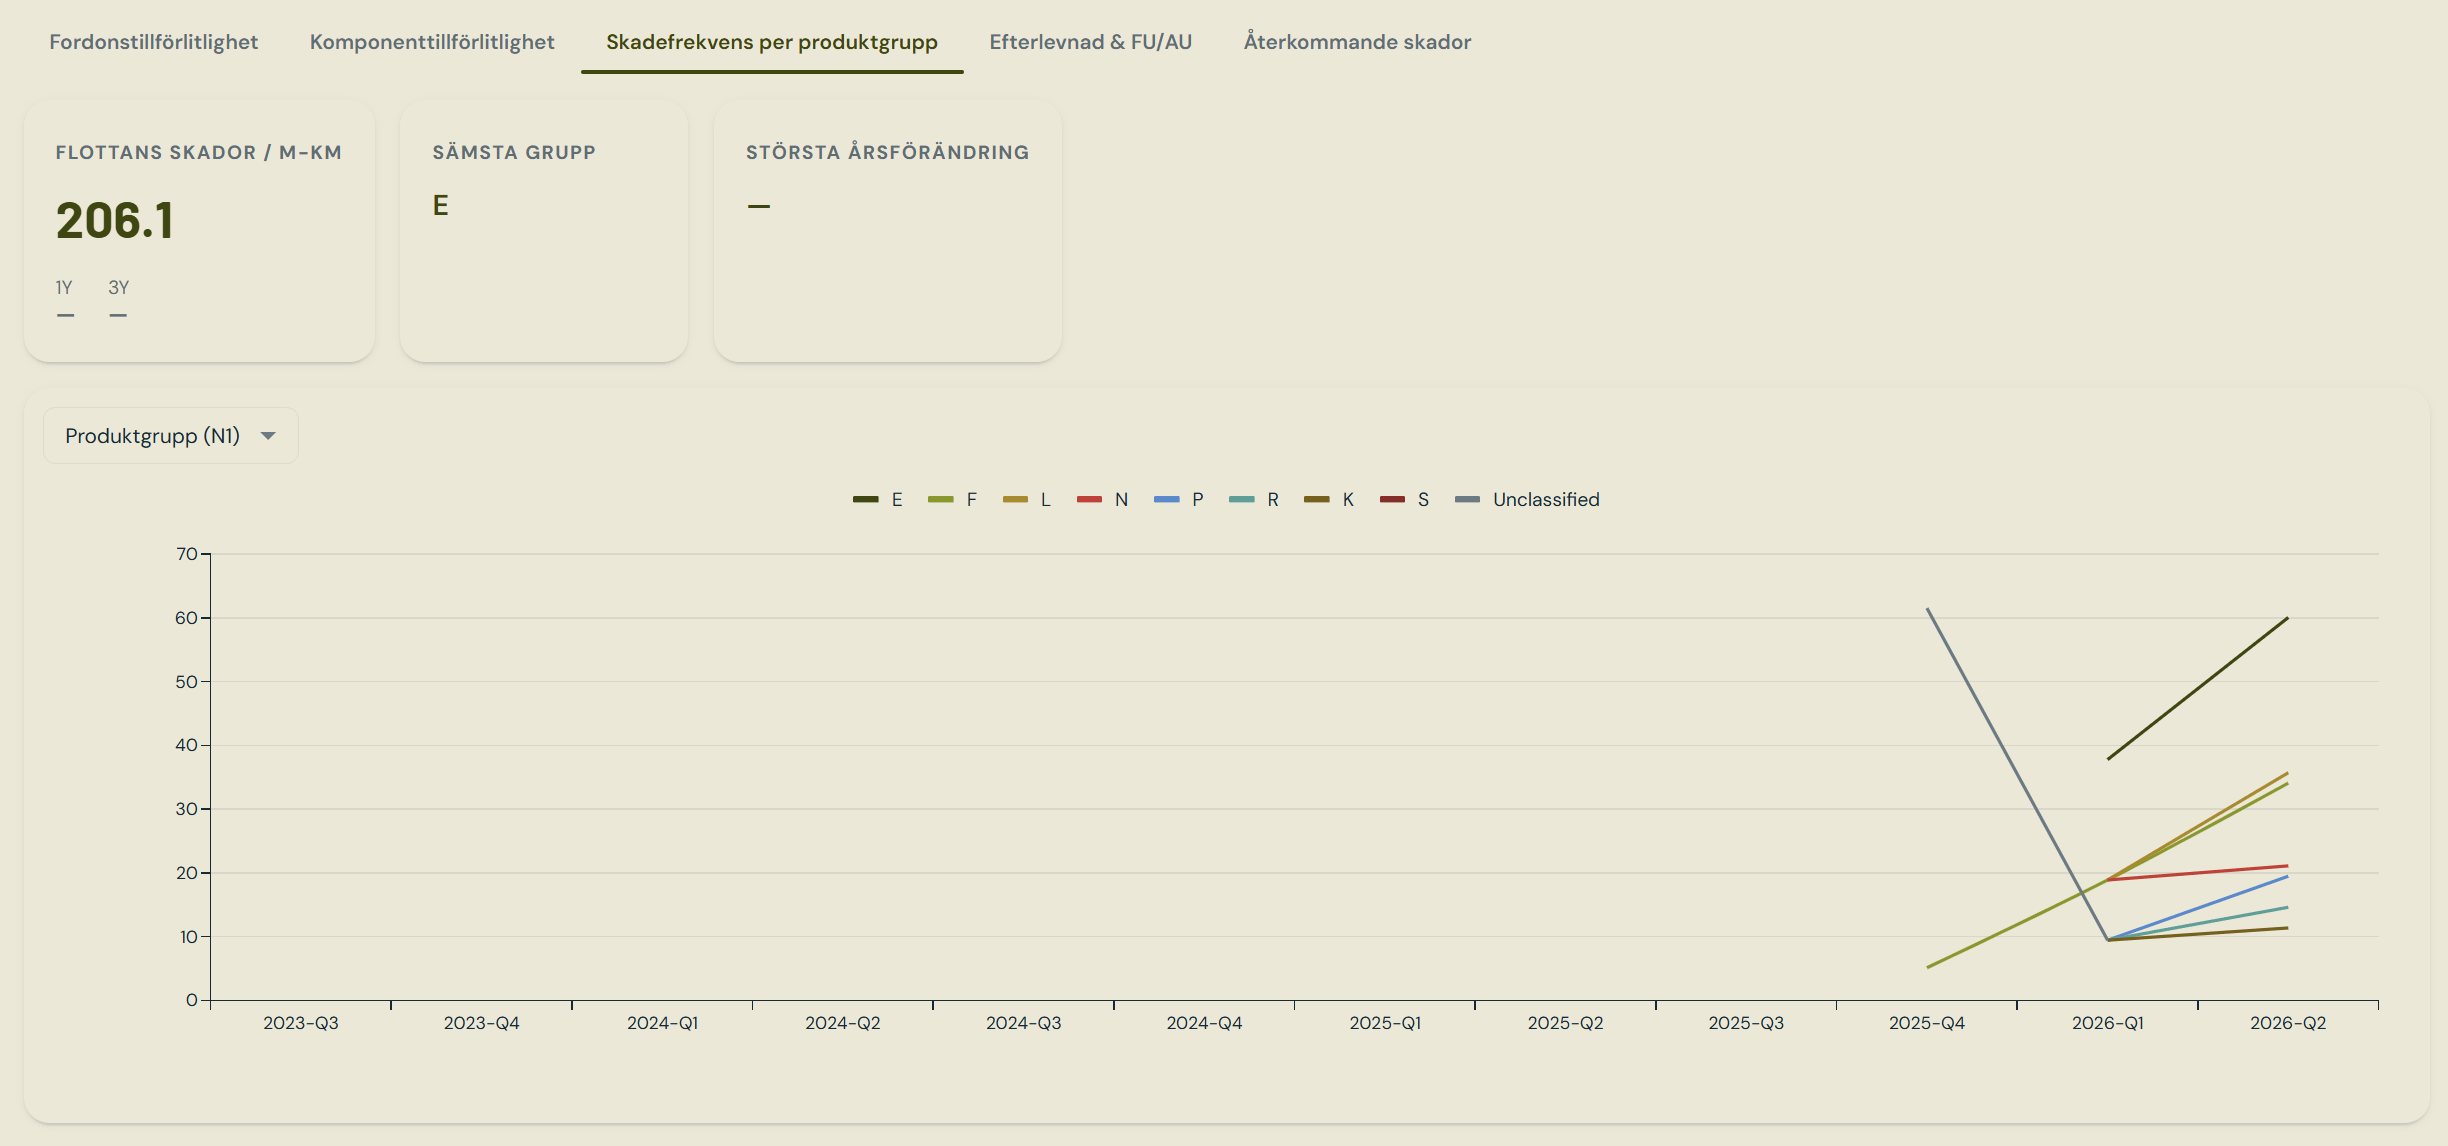 Total defects in the quarter, as a rate per million fleet kilometres, broken down by product
group at level 1 or 2. Also highlights the worst group this quarter and the largest
year-on-year mover.
***
### Compliance & FU/AU
Total defects in the quarter, as a rate per million fleet kilometres, broken down by product
group at level 1 or 2. Also highlights the worst group this quarter and the largest
year-on-year mover.
***
### Compliance & FU/AU
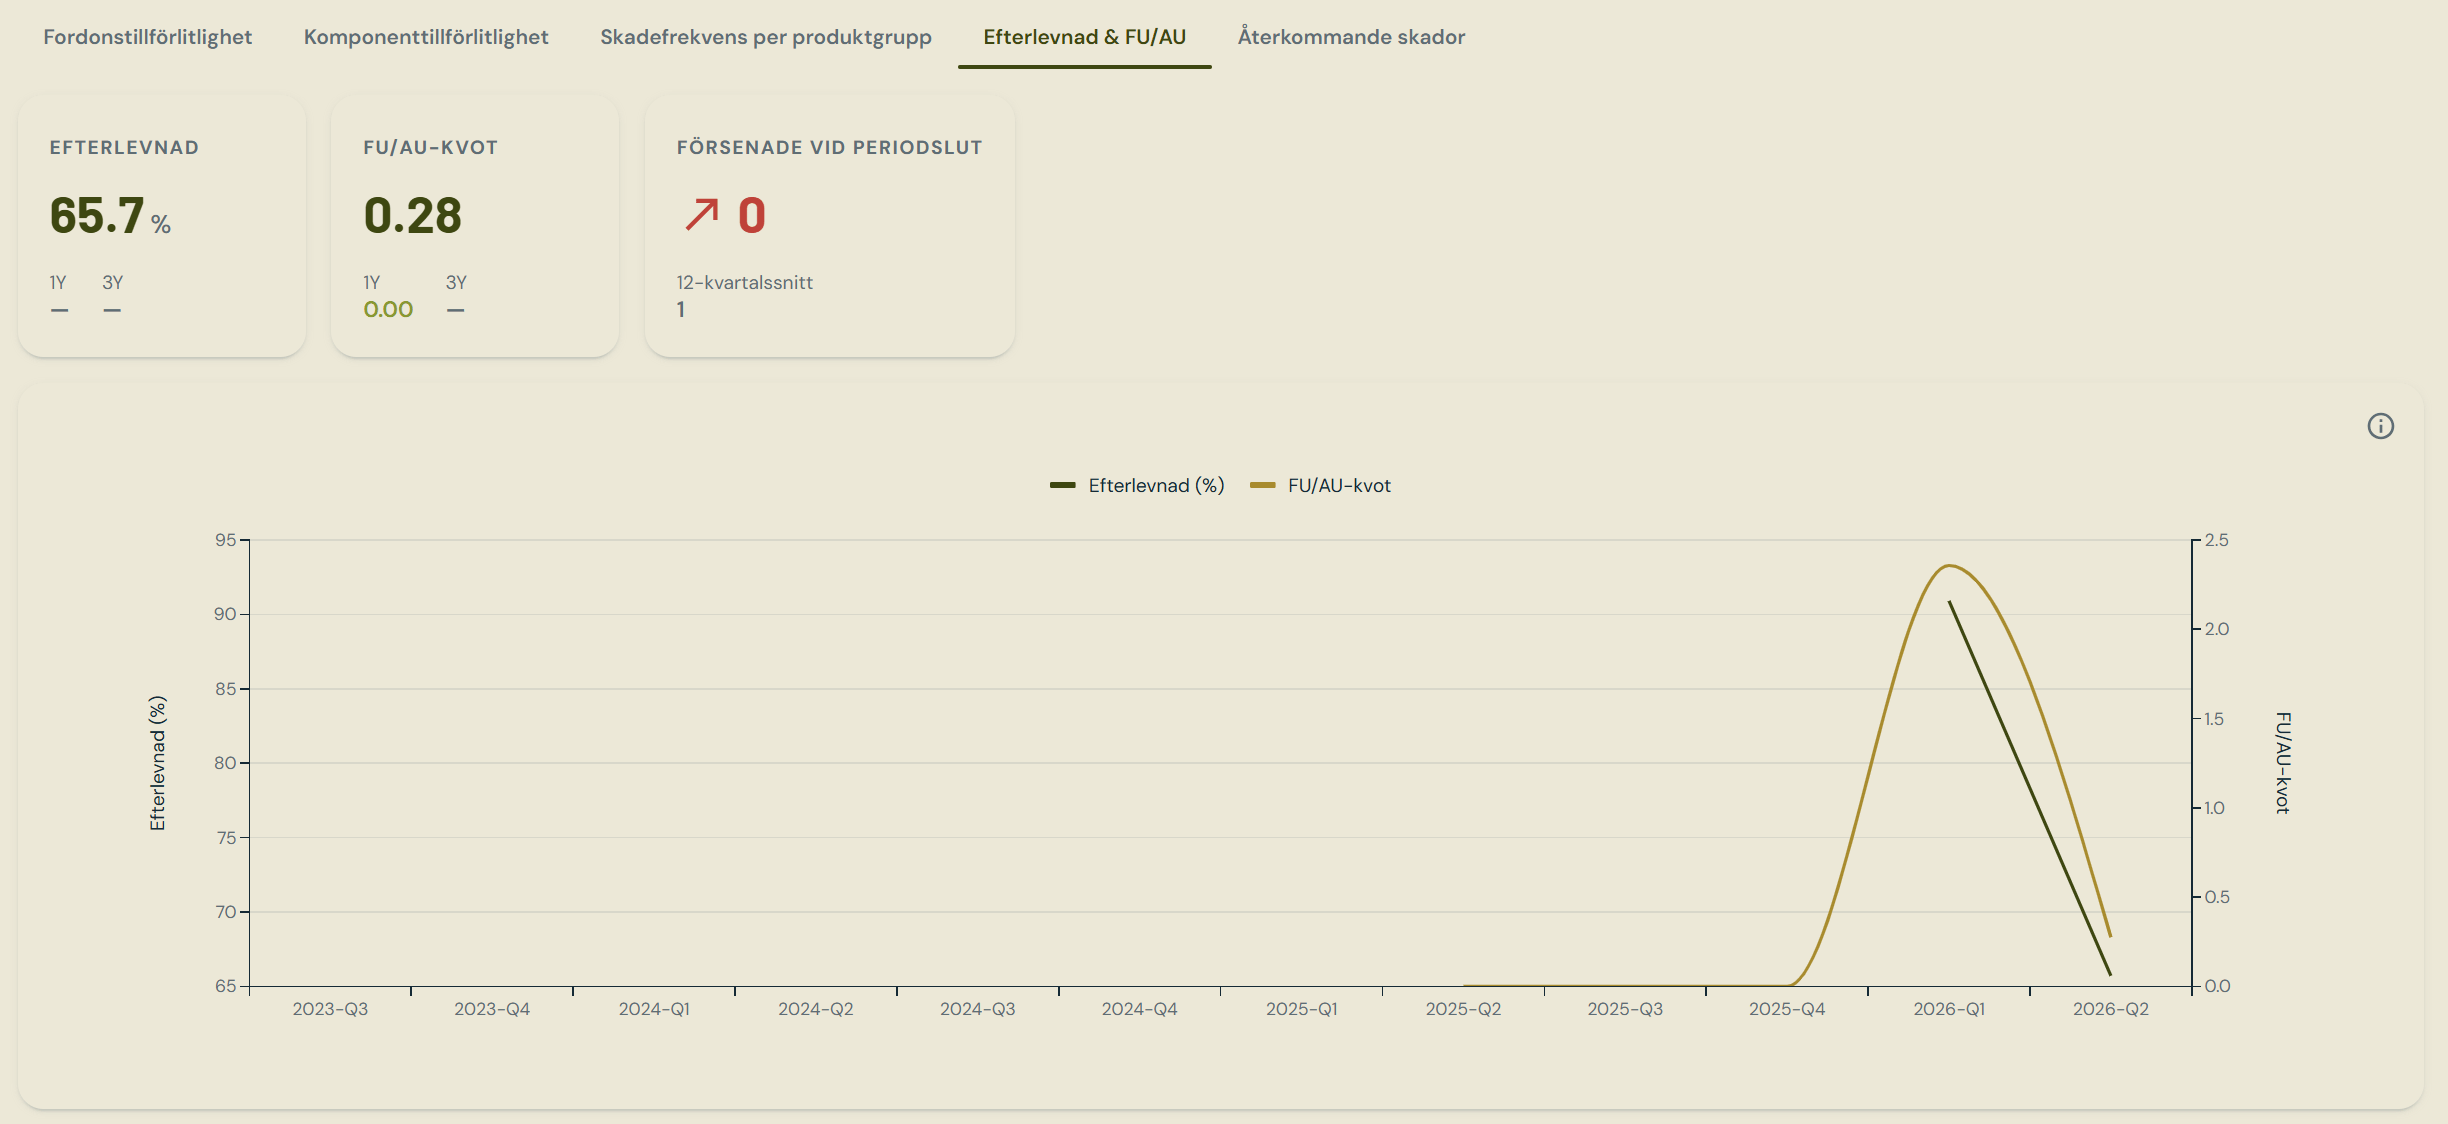 | Metric | Definition |
| -------------------------------- | ----------------------------------------------------------------------------------------------------------------- |
| **Compliance %** | Of maintenance records linked to a task, the share whose deviation fell inside the task's before/after tolerances |
| **Planned vs unplanned (FU/AU)** | Maintenance record count ÷ defect count. Higher is better |
| **Overdue at period end** | Overdue and overdue-safety tasks as at the quarter's close |
***
### Repeat Defects
| Metric | Definition |
| -------------------------------- | ----------------------------------------------------------------------------------------------------------------- |
| **Compliance %** | Of maintenance records linked to a task, the share whose deviation fell inside the task's before/after tolerances |
| **Planned vs unplanned (FU/AU)** | Maintenance record count ÷ defect count. Higher is better |
| **Overdue at period end** | Overdue and overdue-safety tasks as at the quarter's close |
***
### Repeat Defects
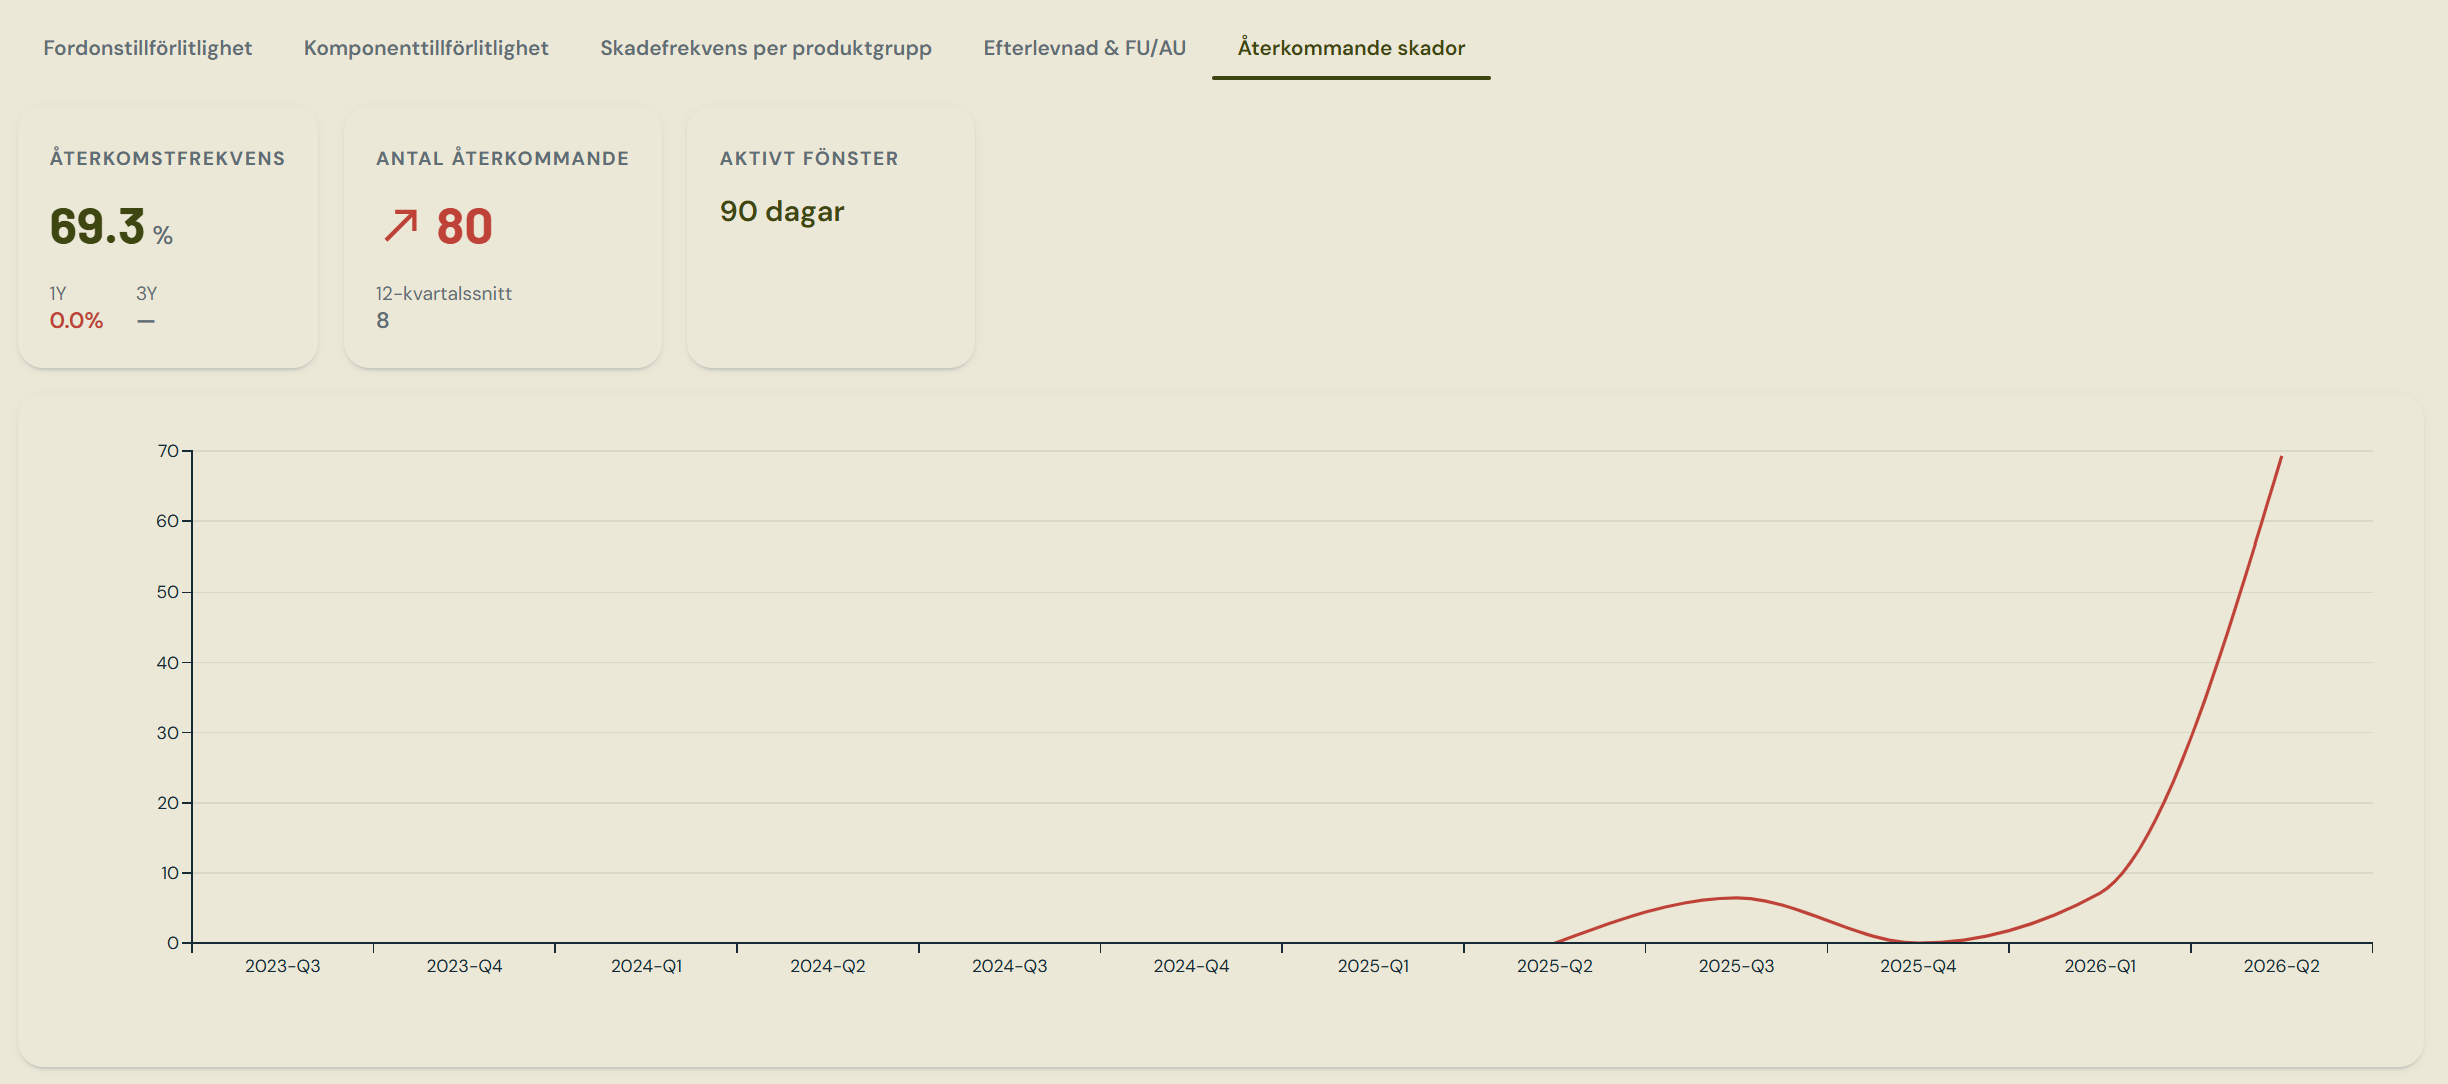 The share of defects in the quarter that had a **prior defect on the same vehicle, in the
same product-group area, within a rolling window** — 90 days by default, adjustable.
***
## Roles
Requires **Asset Manager**.
The share of defects in the quarter that had a **prior defect on the same vehicle, in the
same product-group area, within a rolling window** — 90 days by default, adjustable.
***
## Roles
Requires **Asset Manager**.