> ## Documentation Index
> Fetch the complete documentation index at: https://docs.a7manager.se/llms.txt
> Use this file to discover all available pages before exploring further.
# Wheel Analysis
> Wear trends, remaining life, and the reframing demand forecast.
Four views over wheel measurement data — how fast wheels wear, how much life is left, and how
much reframing work is coming.
***
## Tabs
| Tab | Shows |
| ------------------------------ | ------------------------------------------------------------------------------------ |
| **Interval Trend** *(default)* | How far and how long wheels run between lathe operations and between full reframings |
| **RUL Heatmap** | Remaining useful life per vehicle and position |
| **Reframing Forecast** | Fleet reframing demand per month over the coming year |
| **Raw Data** | The underlying measurements |
***
### Interval Trend
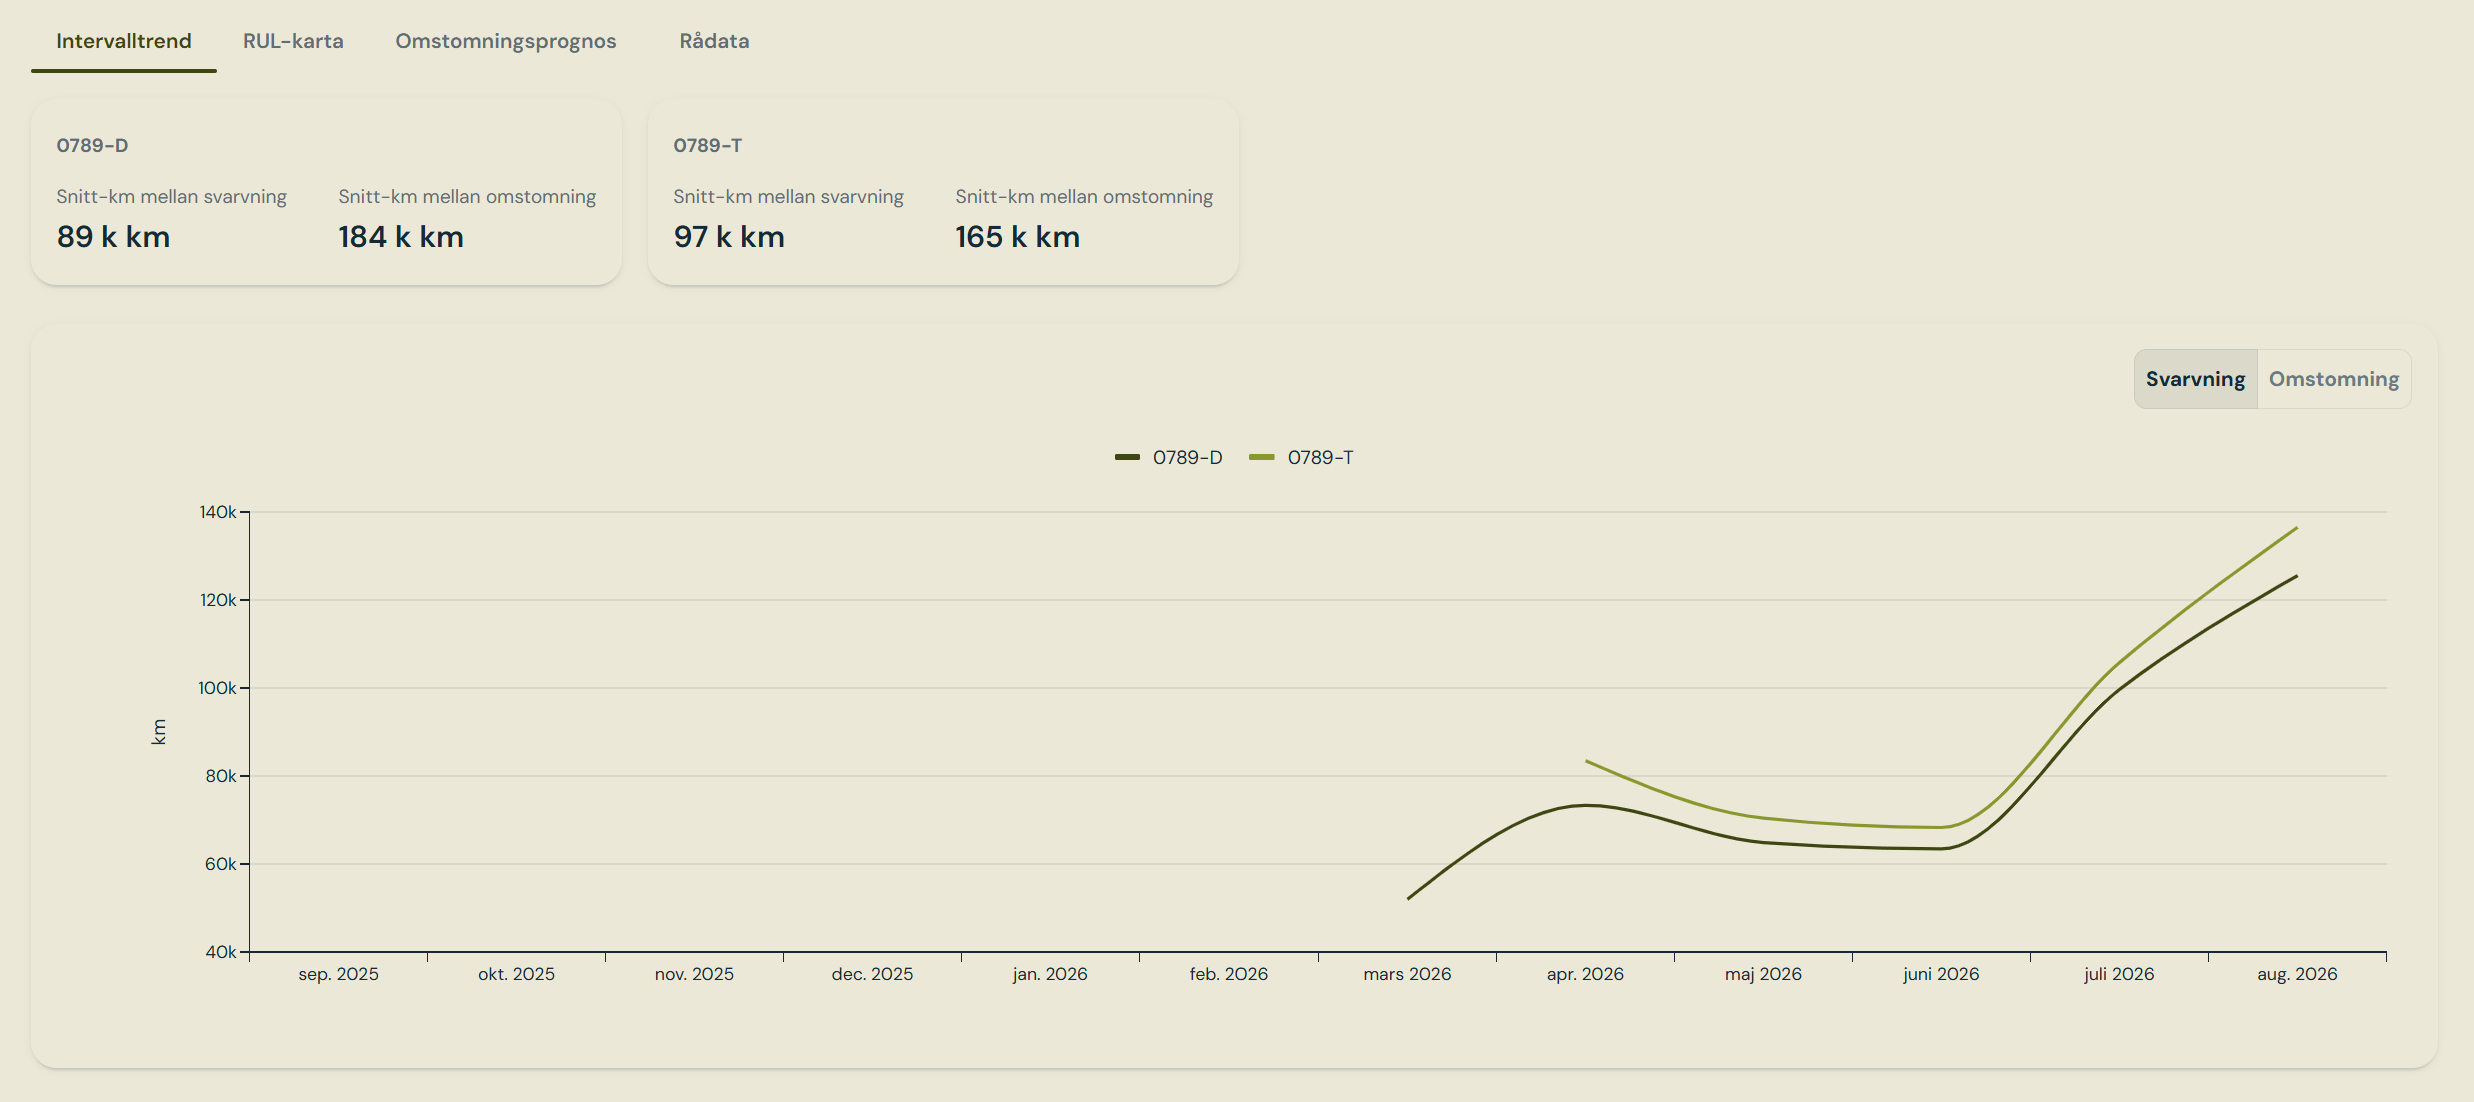 Lifetime averages plus a rolling monthly series, for both kilometres and days between events.
The two intervals count differently on purpose:
* A **lathe** interval restarts at any of delivery, lathe or reframing.
* A **reframing** interval restarts only at delivery or reframing, so it accumulates the full
wear cycle since the last full restoration.
***
### RUL Heatmap
Lifetime averages plus a rolling monthly series, for both kilometres and days between events.
The two intervals count differently on purpose:
* A **lathe** interval restarts at any of delivery, lathe or reframing.
* A **reframing** interval restarts only at delivery or reframing, so it accumulates the full
wear cycle since the last full restoration.
***
### RUL Heatmap
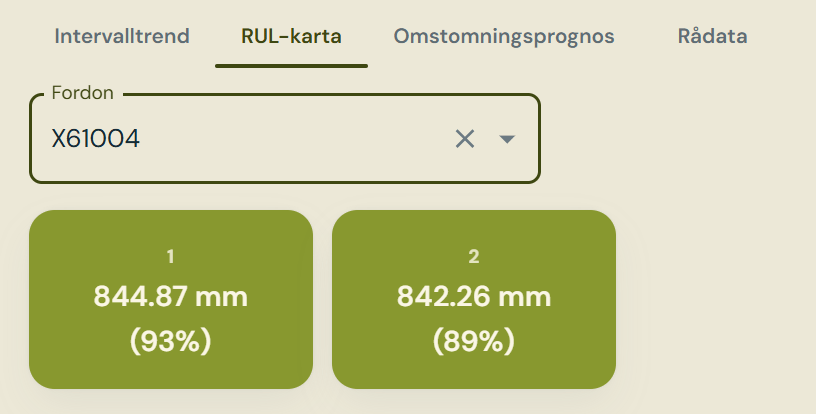 A per-vehicle, per-position snapshot of wear margin:
```
percent remaining = (latest value − minimum) ÷ (nominal − minimum) × 100
```
| Band | Meaning |
| ------ | ------------------------------------------- |
| Red | 10% or less remaining |
| Amber | Under 25% |
| Yellow | Under 50% |
| Green | Above 50% |
| Grey | No mounted component, or no readings for it |
The reading comes from whichever component is **currently mounted**, so wear follows the
component as it moves between positions rather than staying with the position.
***
### Reframing Forecast
A per-vehicle, per-position snapshot of wear margin:
```
percent remaining = (latest value − minimum) ÷ (nominal − minimum) × 100
```
| Band | Meaning |
| ------ | ------------------------------------------- |
| Red | 10% or less remaining |
| Amber | Under 25% |
| Yellow | Under 50% |
| Green | Above 50% |
| Grey | No mounted component, or no readings for it |
The reading comes from whichever component is **currently mounted**, so wear follows the
component as it moves between positions rather than staying with the position.
***
### Reframing Forecast
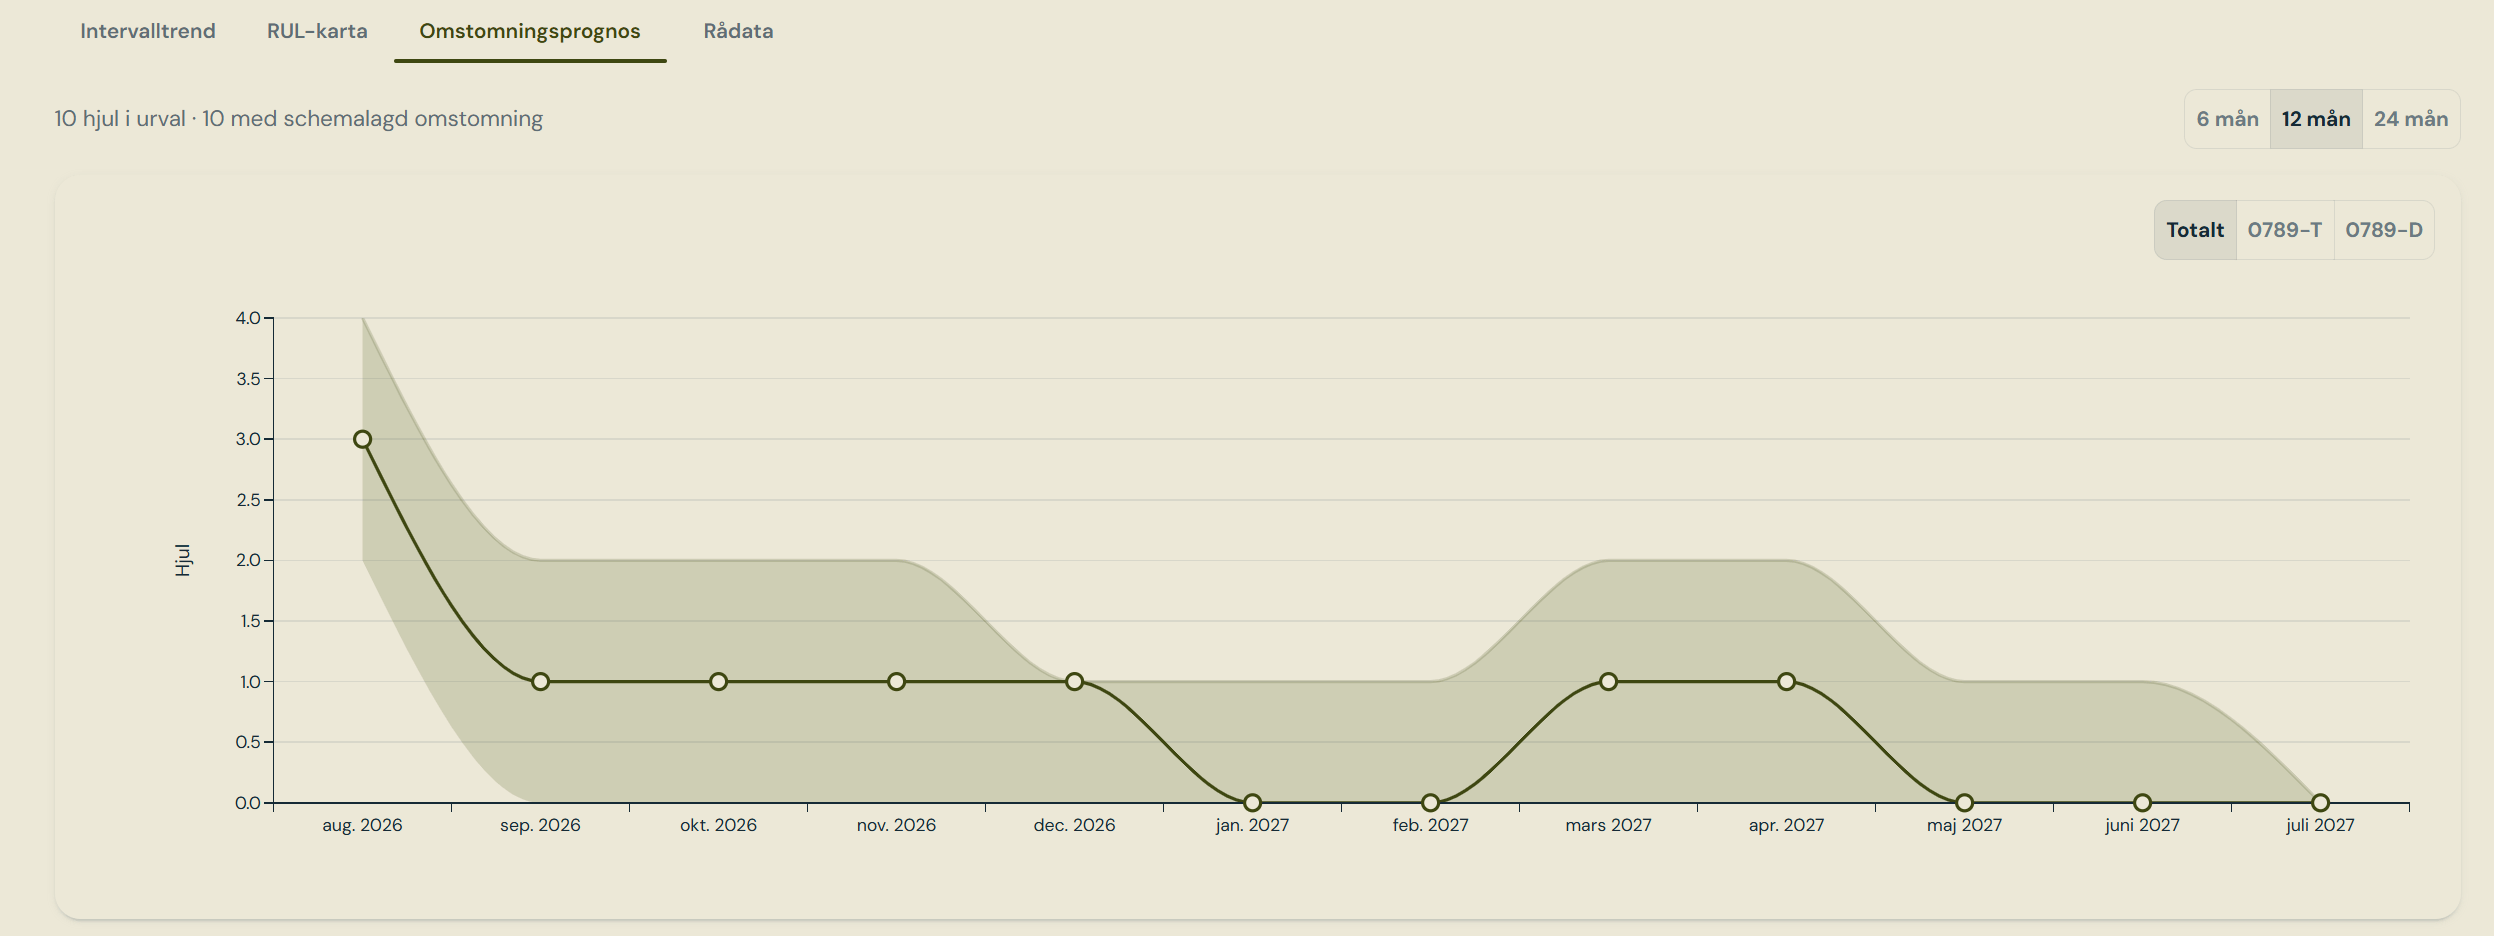 Answers a workshop capacity question: **how many wheels across the fleet will need reframing
in each calendar month** over the next twelve, with uncertainty bands.
It is deliberately a fleet count, not a per-wheel prediction of dates.
A Monte Carlo simulation over roughly two thousand draws, reporting the median, mean and a
10th-to-90th-percentile band per month.
**Wear rate** is drawn from the component *type's* population rather than the individual
wheel's own history, on the reasoning that wheels of a type are interchangeable and get
swapped across trains and positions during their life.
**Remaining material** comes from the last known diameter — the most recent delivery,
lathe or reframing event — minus wear already accrued since.
**Kilometres become calendar time** through a usage rate pooled across the vehicle type,
so a vehicle with sparse readings inherits its type's duty cycle.
Wear is not the only thing that brings a wheel in. Where a measurement threshold names a
reframing task in a maintenance plan, the scheduled interval acts as a cap: whichever
comes first — wear reaching the limit, or the preventive schedule falling due — is what
the forecast counts.
The page reports how many wheels are in scope and how many carry such a cap.
The forecast is cached and recomputed monthly, and can be run as of a past date for a genuine
point-in-time view.
***
## Related
Measurement types, their thresholds and their progression rules are configured on
[Measurements](/pages/measurement-config). The underlying data arrives via the
[`measurements`](/data/files/measurements) import.
Answers a workshop capacity question: **how many wheels across the fleet will need reframing
in each calendar month** over the next twelve, with uncertainty bands.
It is deliberately a fleet count, not a per-wheel prediction of dates.
A Monte Carlo simulation over roughly two thousand draws, reporting the median, mean and a
10th-to-90th-percentile band per month.
**Wear rate** is drawn from the component *type's* population rather than the individual
wheel's own history, on the reasoning that wheels of a type are interchangeable and get
swapped across trains and positions during their life.
**Remaining material** comes from the last known diameter — the most recent delivery,
lathe or reframing event — minus wear already accrued since.
**Kilometres become calendar time** through a usage rate pooled across the vehicle type,
so a vehicle with sparse readings inherits its type's duty cycle.
Wear is not the only thing that brings a wheel in. Where a measurement threshold names a
reframing task in a maintenance plan, the scheduled interval acts as a cap: whichever
comes first — wear reaching the limit, or the preventive schedule falling due — is what
the forecast counts.
The page reports how many wheels are in scope and how many carry such a cap.
The forecast is cached and recomputed monthly, and can be run as of a past date for a genuine
point-in-time view.
***
## Related
Measurement types, their thresholds and their progression rules are configured on
[Measurements](/pages/measurement-config). The underlying data arrives via the
[`measurements`](/data/files/measurements) import.