Tabs
Interval Trend
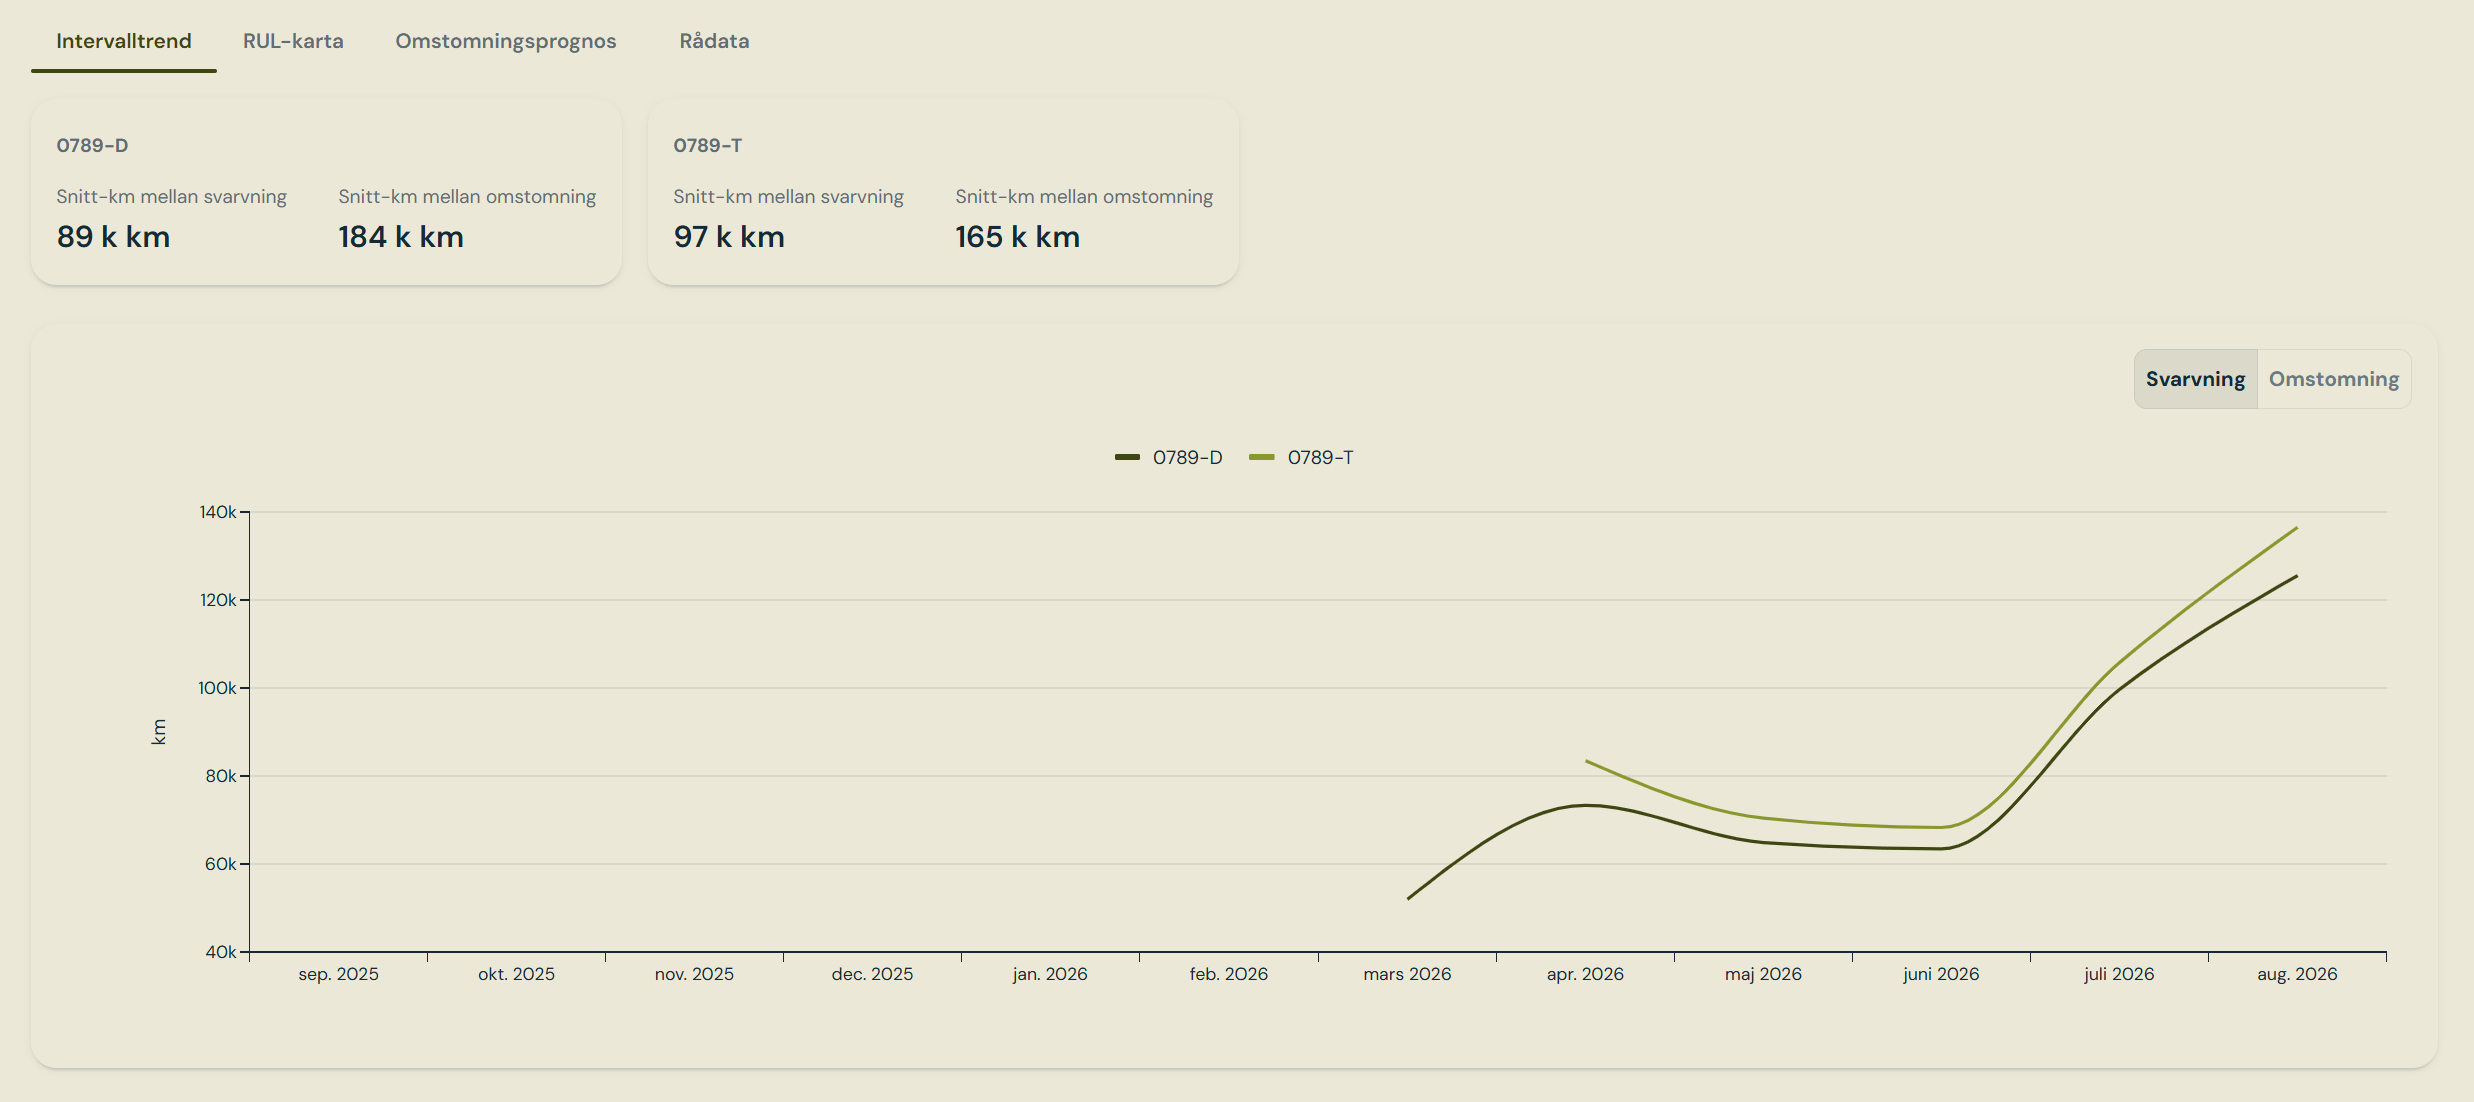
Intervalltrend — rolling monthly kilometres between lathe operations, per wheel type
- A lathe interval restarts at any of delivery, lathe or reframing.
- A reframing interval restarts only at delivery or reframing, so it accumulates the full wear cycle since the last full restoration.
RUL Heatmap
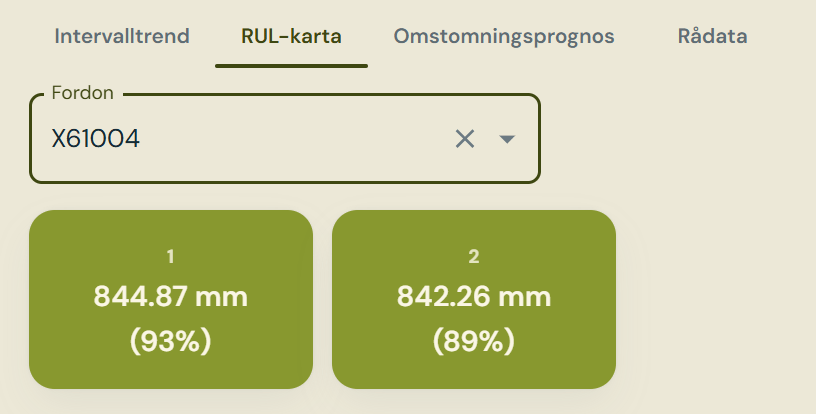
RUL-karta — remaining life per wheel position for the selected vehicle
The reading comes from whichever component is currently mounted, so wear follows the
component as it moves between positions rather than staying with the position.
Reframing Forecast
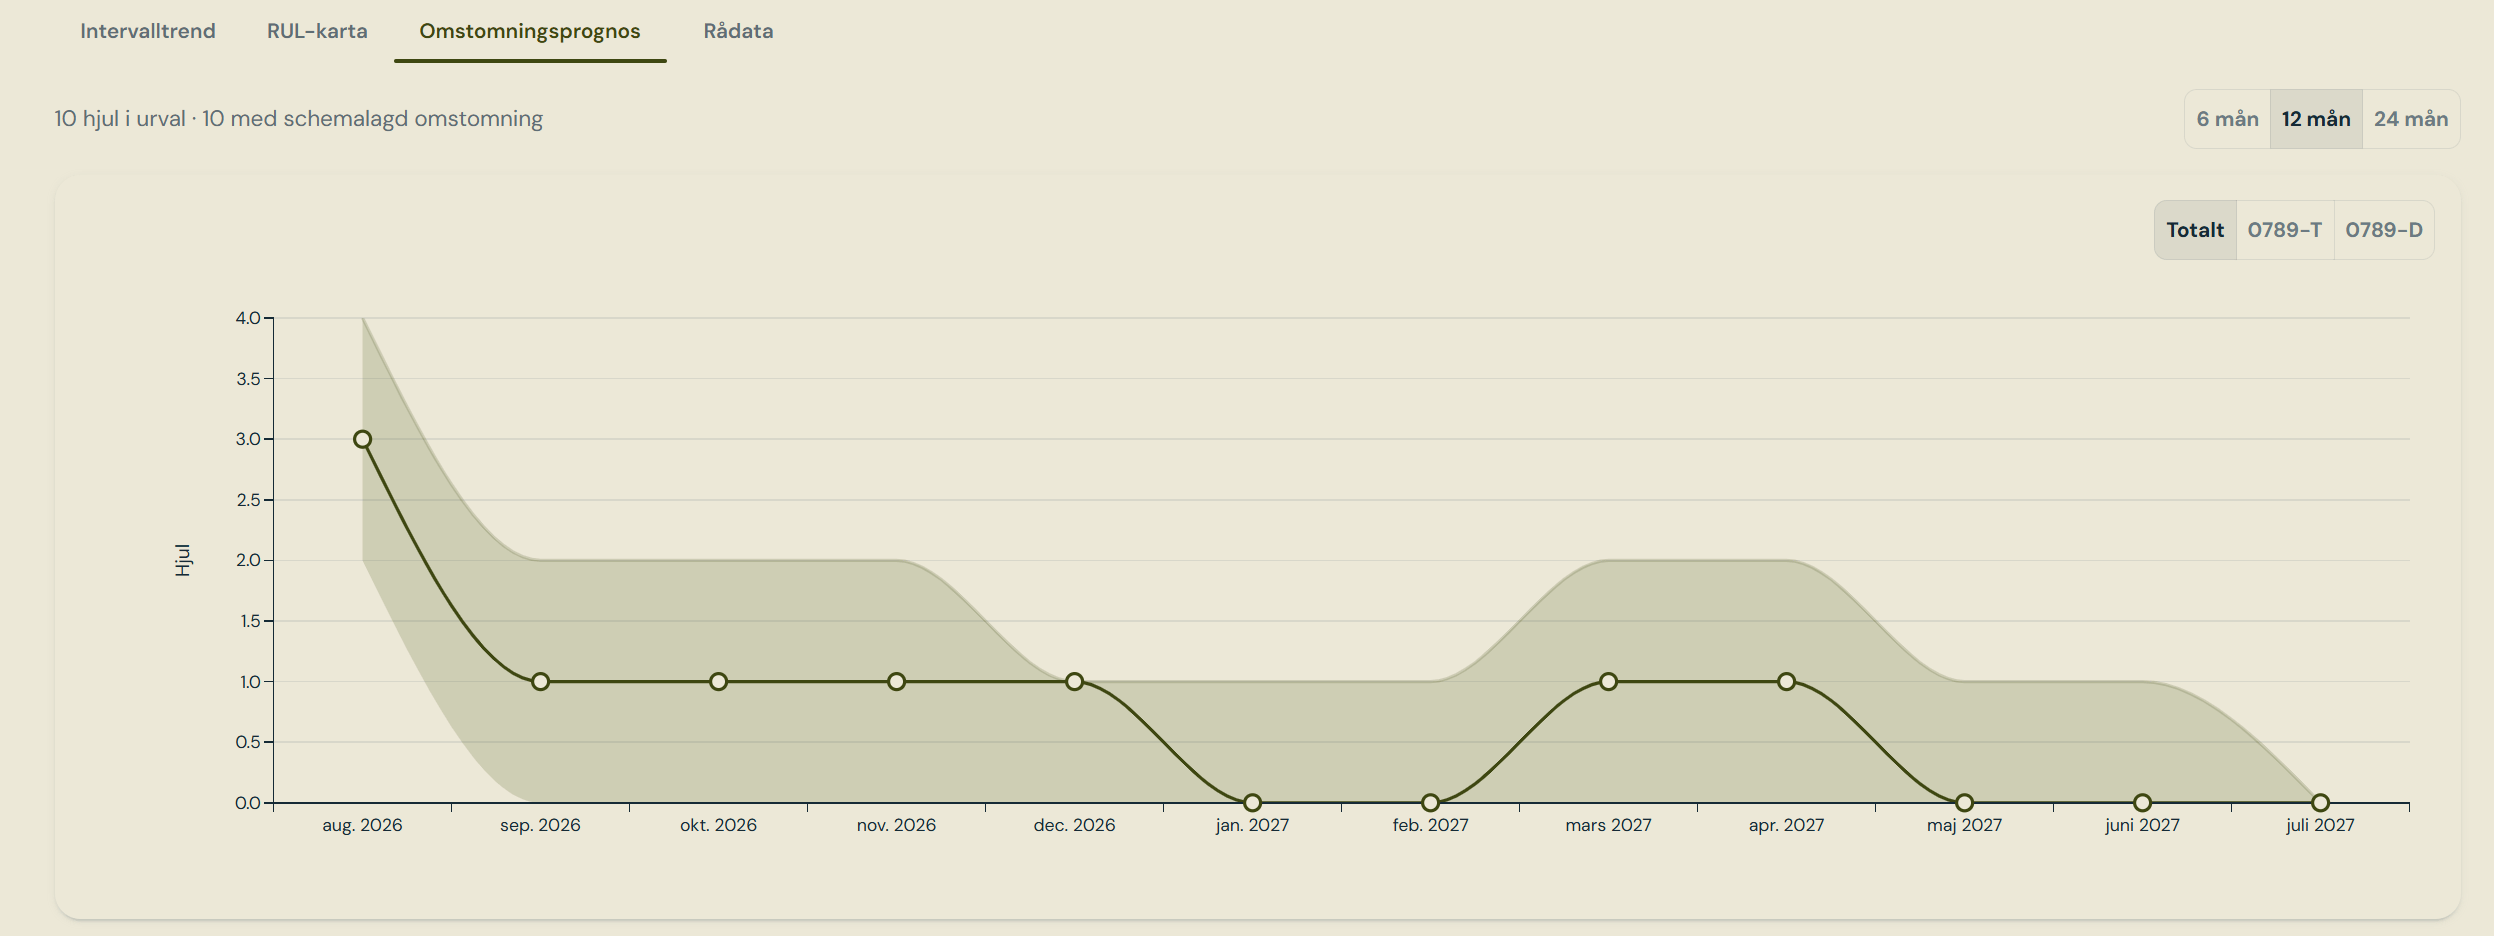
Omstomningsprognos — median wheels due per month, with the 10th-to-90th-percentile band
How it works
How it works
A Monte Carlo simulation over roughly two thousand draws, reporting the median, mean and a
10th-to-90th-percentile band per month.Wear rate is drawn from the component type’s population rather than the individual
wheel’s own history, on the reasoning that wheels of a type are interchangeable and get
swapped across trains and positions during their life.Remaining material comes from the last known diameter — the most recent delivery,
lathe or reframing event — minus wear already accrued since.Kilometres become calendar time through a usage rate pooled across the vehicle type,
so a vehicle with sparse readings inherits its type’s duty cycle.
The preventive schedule cap
The preventive schedule cap
Wear is not the only thing that brings a wheel in. Where a measurement threshold names a
reframing task in a maintenance plan, the scheduled interval acts as a cap: whichever
comes first — wear reaching the limit, or the preventive schedule falling due — is what
the forecast counts.The page reports how many wheels are in scope and how many carry such a cap.
Related
Measurement types, their thresholds and their progression rules are configured on Measurements. The underlying data arrives via themeasurements import.